Profit Margin Ratio Hi! Before this video you should already understand the words and concepts found in Financial Statements. Now, when I say Financial Statements I mean the Balance Sheet and Income Statement. Alright, so welcome back again in MBAbullshit.com. The topic for this video is Profit Margin which is one of the measures of profitability among financial ratios. So, let’s analyze this ratio now, remember you can always go back to MBAbullshit.com. This video discusses and analyzes the profit margin which is one of my free videos on Liquidity and Profitability and Market Value which include Current Ratio, Quick Ratio, Cash Ratio, Profit Margi, ROI Return On Investment, ROA Return On Assets, ROE Return on Equity, P/E Price Earnings ratio and Market to Book Ratio.
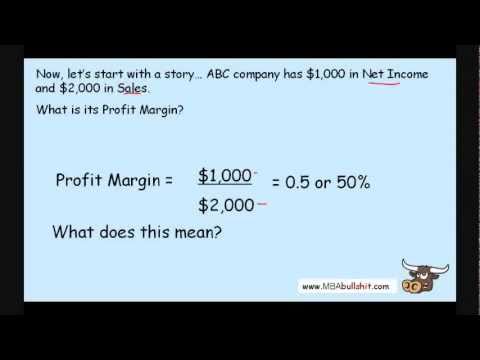
After these you can check out my next videos on MBAbullshit.com such as my video on Financial Leverage Ratio Critical Analysis which includes: Total Debt Ratio, Debt-Equity ratio, equity Multiplier, Times-Interest earned ratio, Cash Coverage ratio and my other video on Turnover Ratios Critical Analysis which includes inventory Turnover, Day’s Sales Inventory, Receivables Turnover, Day’s Sales Receivables Payable Turnover, Ave. Days to Pay and Total Asset Turnover. Alright, so let’s get down to it. So, let’s start with a story. Let’s say that ABC Company has $1000 in Net Income and $2000 in Sales.
What it it’s Profit Margin? It’s very simple, when it comes to Financial ratio, the actual ratio is very simple what’s more important is what the ratio tells you. Okay, so the computation is simply $1000 divided by $2000. Where do we get this 1000?-it’s the net income. Where do we get the 2000?-It is the Sales. We divide that by each other and we find we have a profit margin of or 50% which is quite high I think. Now, but after you see later, high or low it’s relative depending on what you compare it against whether you compare it with similar company or you compare it with your historical profit margin of your company or of this company.
Alright, so what does the 50% profit means? Well, simply it means every time the company makes $100 in Sales it makes on the average a fifty-dollar profit, okay. So, that’s what it means. Therefore, a higher profit margin is usually considered better. However, there are some flaws in using this ratio. Some companies can have a very low profit margin but still be very profitable for example Wal-Mart. Why is Wal-Mart so successful? Well, the many reasons why Wal-Mart is successful but I guess the main reason why Wal-Mart is successful is it’s very cheap. And one of the reasons why it’s very cheap is because Wal-Mart has a low profit margin. So, they don’t add much profit between the cost of the stuff they’re selling and the actual sales. So Wal-Mart has low profit margin but huge volume profit in the end. If Wal-Mart would try to increase its profit margin the prices would go up and that they would lose volume and they probably would become not profitable.
People would go to Wal-Mart because it’s cheap. The second flaw in using this ratio is that a high profit margin does not necessarily mean high cash flow. Remember, Financial managers prefer Cashflow over “Profit”, instead of profit. So, in some cases not in the cases of Wal-Mart which is cash basis. But in some companies, a company might have a high profit margin because of accrued sales and not cash sales.
Accrues Sales means you made a sale but then the costumer hasn’t paid you yet for the service. So, if you already made the sale but the costumer hasn’t paid you, it will still appear as a sale in your income statement. And therefore you might not be able to benefit yet from this profit because the cash part of the profit or you might get the cash very far into the future. There are also some Traditional ways of analyzing financial ratios and the first is to compare for historical profit margin of your company. Compare your most recent profit margin with last year’s profit compare it with your historical profit. If your profit margin is higher now than last year’s then it night indicate better cost and expense management than before and may also indicate, I use indicate because it’s not 100% sure, it’s just an indicator and on a more profitable company If your profit margin is lower than the last year’s then this must indicate a lousier cost and expense management than the earlier years and on the last profitable company.
The next thing you do in the Traditional Analysis of Financial ratio is to compare with other similar companies. I stress similar because it’s useless to compare Wal-Mart to a Car Company like Toyota. Obviously, a car company would have very high profit margin but less than. A car company not Toyota, a car company maybe, a car company like Ferrari, obviously a car company like Ferrari would have a high profit margin but they have low volume. Wal-Mart would have a very low profit margin but high volume. So, when you look at the profit of Wal-Mart , it’s best compared to the profit margin of Target for example.
If your profit margin is high than theirs then this might indicate proper cost and expense management than theirs and it might indicate a more profitable company. If the profit margin is lower than theirs, then this might indicate lousier cost and expense management than them and/or a less profitable company. Alright, so there you have it. Remember to share if you like it and follow me on twitter just look for @MBAbullshit. And join my fan page on facebook.com to get the latest updates on my latest videos, I usually post them first on Facebook.
So, go to facebook.com/MBAbullshit and please forward my YouTube links on your email or on your other social media. So, have a great day and goodbye. debbierojonan Page 1 .
As found on Youtube